

Data, data, data! Through the halls of our schools, that’s what teachers are talking about - and we're using it to drive instruction. The question is, are we using it correctly? The "big data movement" has had some negative side effects, involving testing phobia among students and incredible stress among staff - but if you know how to use the data correctly, both educators and students can find their way to a virtual paradise of growth.
It doesn’t matter what your district or school uses for data purposes. Many schools across the country are using the MAP (Measures of Academic Progress) test, running records through Fountas and Pinnell, or maybe even basic common assessments. The first thing we all need to wrap our brains around is the difference between formative and summative assessments...
Formative, as we just discussed, gives you information on where exactly your students are in their instructional journey. Summative assessments are your end-of-year state mandatory tests. Most testing in schools is formative, but is unfortunately used as summative. This is not recommended, as it leads to negative feelings about testing. Take the following steps to drive growth and improve your school using data!
1. Look at your formative assessments as being good information for everyone, and ever-changing. In conferencing with students, function as if the teacher does not own the data, but the student does. For example, a student has taken a common assessment with explicit objectives on the exam. It is clear that they have excelled in certain objectives, but not others. During the conference, share the high points, then point out areas to work on. It’s how you communicate with them in a growth mindset-fashion that helps change their mindset. Areas that are lacking are where you support them in small group instruction so they can bridge gaps and excel in all areas.
 2. Create a space where students can chart their growth. This can involve a notebook or folder that contains objectives in the form of "I Can" Statements. (See our Common Core Toolkit for a downloadable ebook, including 388 printable posters that visually display the K-8 standards as “I Can” statements.) If you’re charting a weekly common assessment, give your students a fraction chart to track how many they have correct out of the total number of questions and assign a color to mastery, partial mastery, and non-mastery. My favorites are green, yellow, and red. How they do on their assessment and each particular objective will determine what they color in. Kids love easy visuals; they can connect with that system and start working on ways to improve.
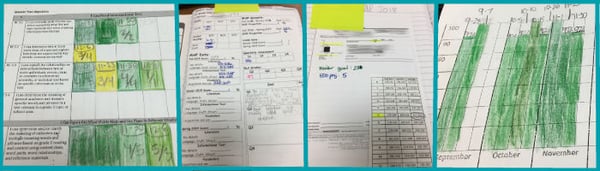
3. Create your own data binder. Keep track of every student and their areas of need. This will come in handy with conferencing and in conversations with administrators. My data binder was separated by my classes and I had an area for any kind of assessment I did. For example, a MAP testing section included the quadrant they create for you to see what kind of growth students are making throughout the year (high growth/high achievement or low growth/low achievement), any kind of summative assessment, spelling levels, plus an area for common assessments. I was lucky to have a great program called Grade Cam which helped create an excel sheet of each objective on my weekly common assessments and tell me how each student did. It’s a very user-friendly program.
4. Lastly, celebrate achievements. There is no child who does not like positive feedback. A positive mindset is one of the biggest motivators in our students’ lives. By creating this kind of environment, you, too will be able to breathe and enjoy teaching a bit more without having to feel that everything is about a number.
Data does not have to be scary, and when you know what to do with it, it can be a powerful motivator throughout the school!
How do you use data in your classroom - perhaps utilizing VariQuest tools? Tell us on Twitter @variquest and we may feature you in an upcoming post!
 |
Carman Le, Education Development Specialist for VariQuest, is an elementary school educator with experience teaching in multiple school settings, ranging from Title I to STEM magnet to National Blue Ribbon schools. Carman has a master’s degree in teaching (MAT) from the University of North Carolina at Charlotte. She was recognized as a MeckEd Teacher of Excellence in 2015. Carman is passionate about collaborating with teachers and engaging students through hands-on learning and the integration of technology. |