
Grade Level: Primary (PK-2) | Grade Level: Intermediate (3-6) | VariQuest Tools: Poster Maker 3600 | Academic Subject: Social Studies and History | Featured Topics: Lessons and Activities | Featured Topics: Templates for FREE download
With Election Day around the corner, now is the time to get students involved in how the election process works and informed about why it is important for them to be voting citizens.
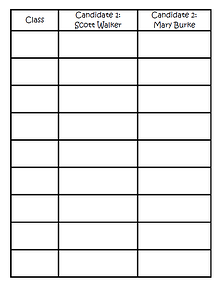
Prior to introducing this lesson to students, create a poster (or two, depending on the size of the student population you will be polling) to track your polling results and gather background information about the gubernatorial (or other) candidates in your state. Click here for a customizable Election Results Chart poster template. This website offers links to most states’ candidates.
Begin by activating students’ prior knowledge about elections by reading a picture book about elections or simply holding a class discussion. Then, show students pictures of each candidate and read a short background about each candidate and their platform.
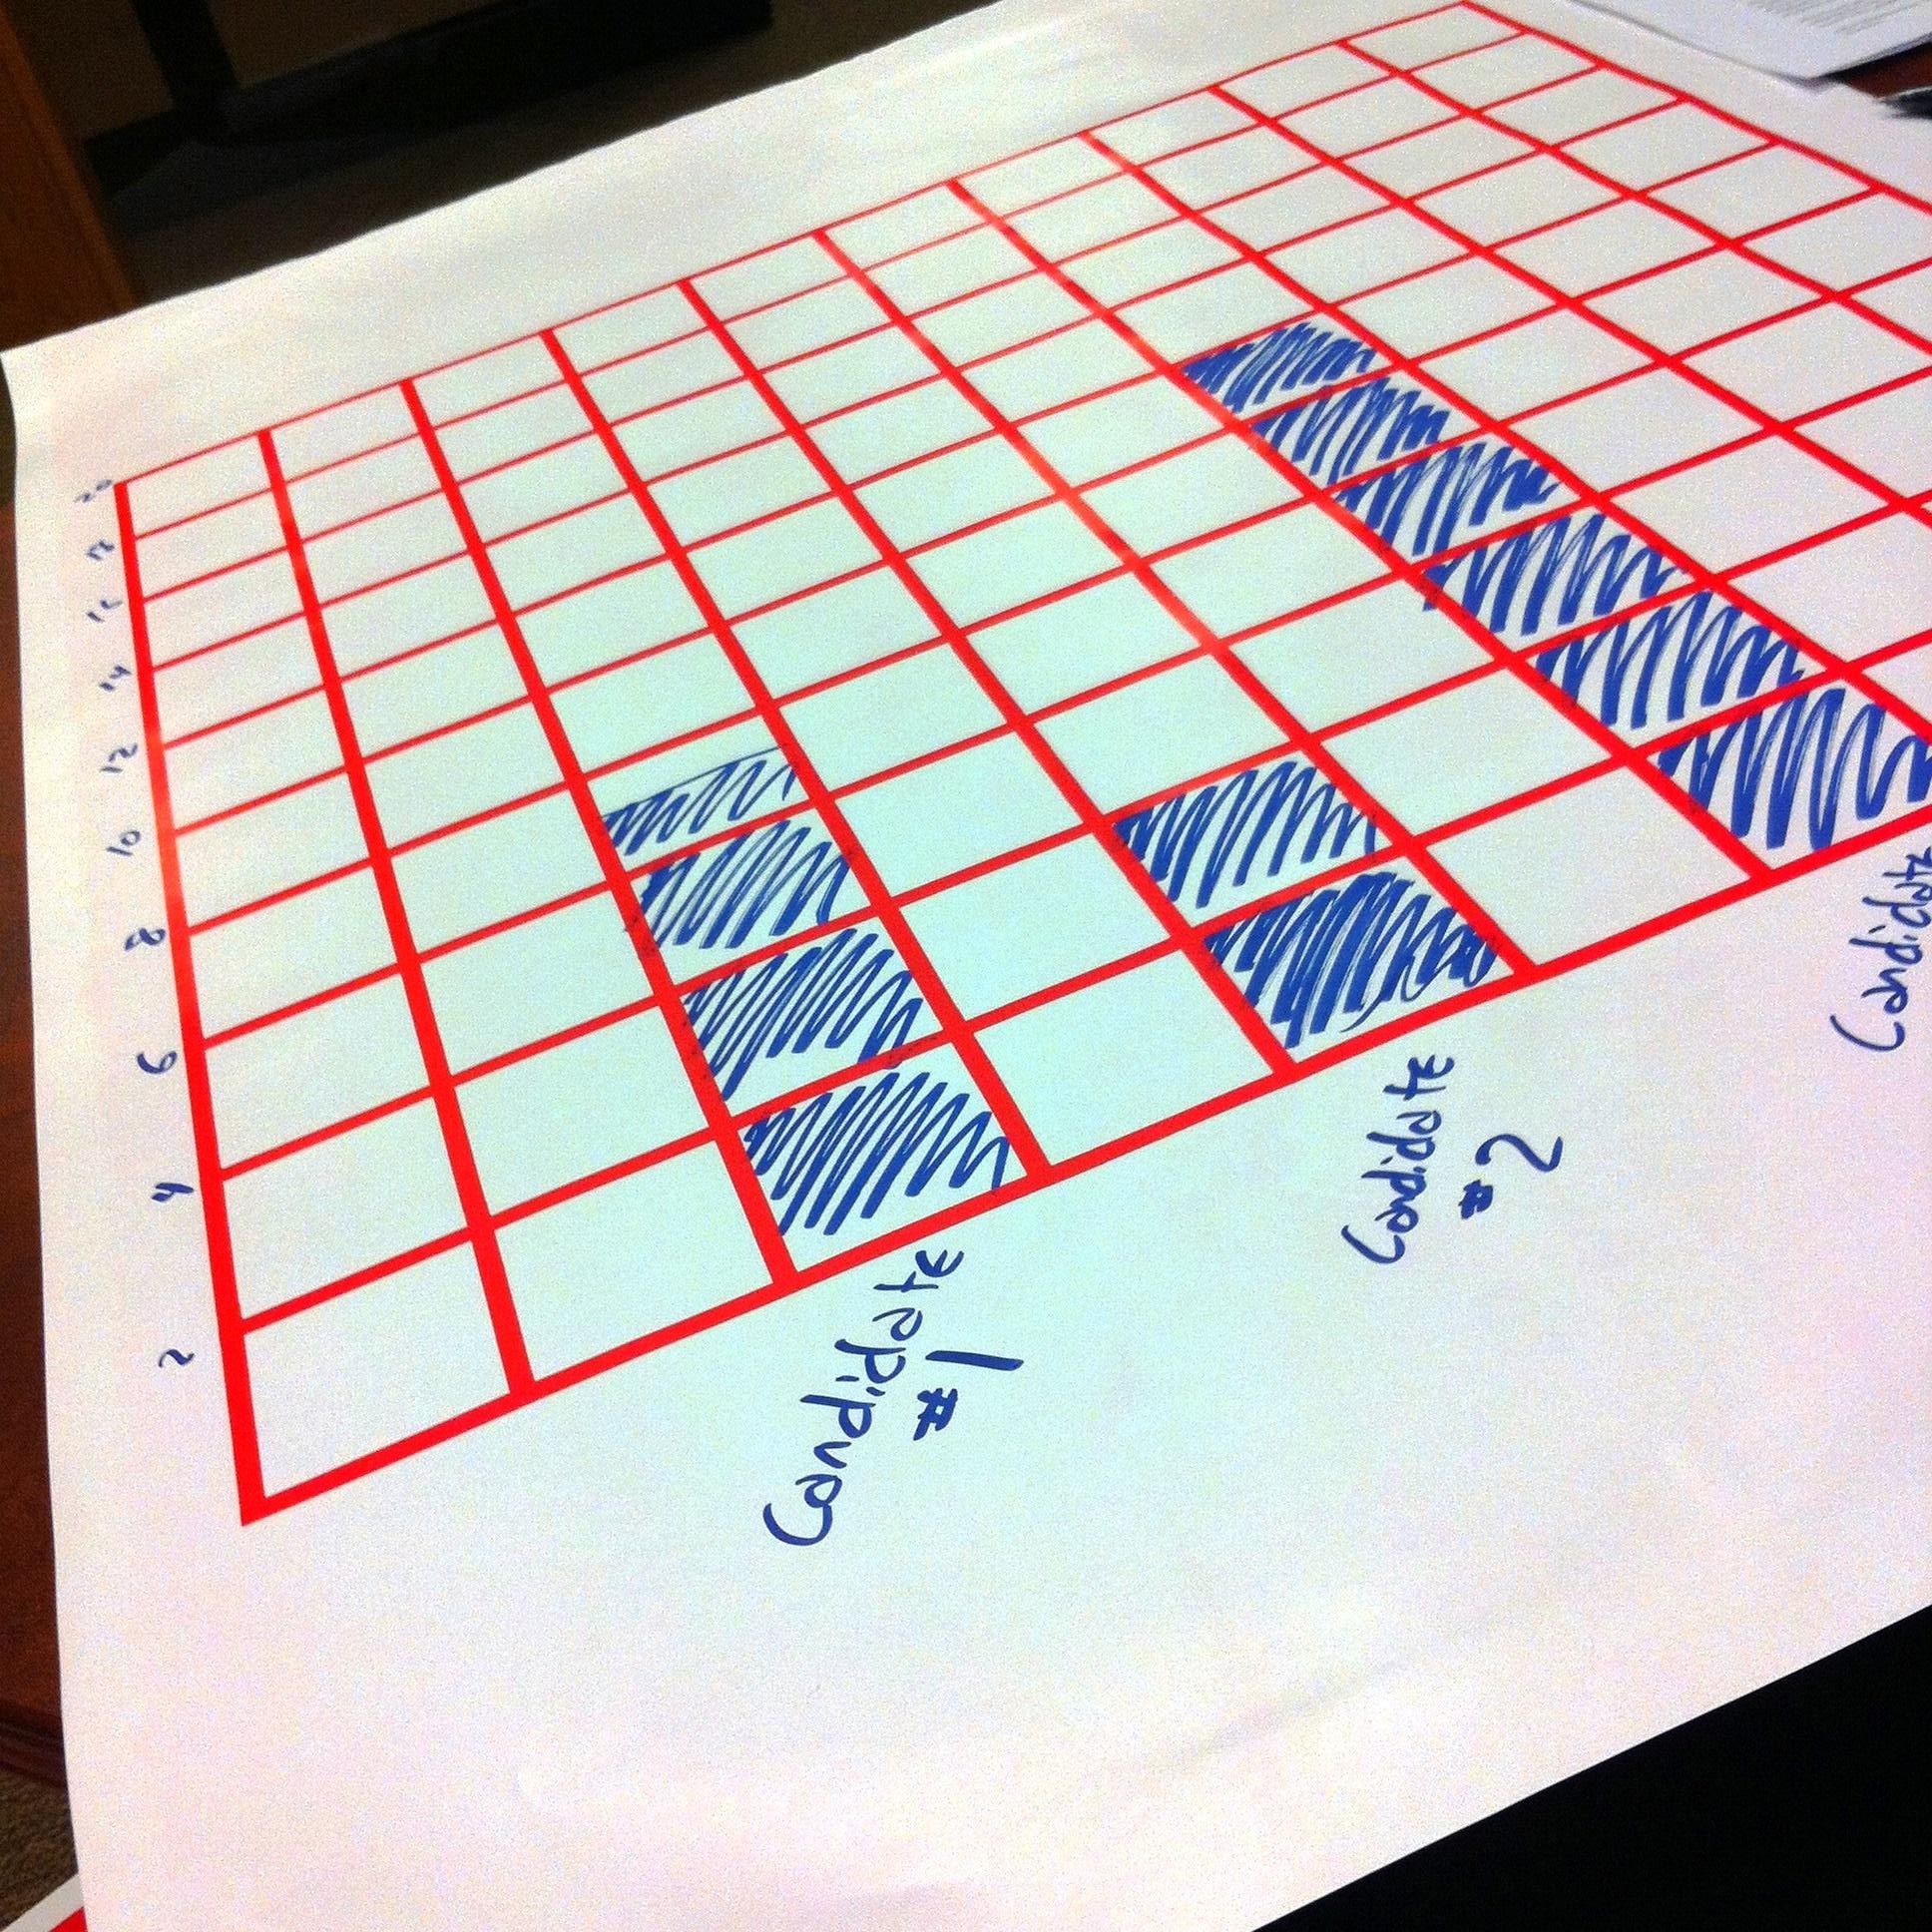
Once students are educated about the candidates, hold a mock election in your classroom, having students participate in the voting process by writing the candidate they are voting for on a piece of paper and submitting it to a box or bucket. Record the classes’ votes by writing tally marks under the appropriate candidate on the Election Results Chart poster. When all of the votes are tallied, declare the winning candidate. Model how to create a bar graph to show a visual representation of the classroom’s election results. Use the Graph Paper Poster Maker template (VIS061) to show students how to create a bar graph.
Next, organize students into small groups and have them decide on a student population outside of the classroom that they will poll. Ideas include assigning each group a different class in your grade, or even a different grade. Schedule time for students to visit other classes, present information about each candidate, poll students, and record their votes.
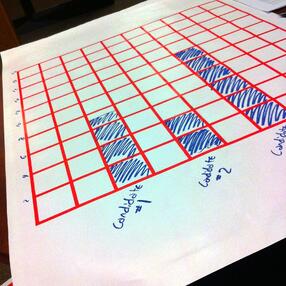
When each group has conducted their polling, have them record the results by tallying the votes on the classroom poster(s). Then, have all students use the data to create a bar graph for each class. Discuss any trends that students see in the data.
After Election Day, compare the school’s results with the results of the state-wide election.
 Julia Cremin is a 6th grade Reading, Language Arts and Math teacher at O'Keeffe Middle School in Madison, WI. She is certified in Elementary Education (grades 1-9) with a minor in Mathematics. This is her fourth year teaching middle school.